SUSTAINABILITY PERFORMANCE
We are devoted to reducing our environmental footprint on this earth and actively monitor our energy and water usage to help guide our reduction efforts. We then publish the results below for transparency and accountability.
In addition, we track our efforts to reduce the overall volume of waste that we cannot recycle or compost on site.
We are also proud of our standing in granting equal opportunity to all staff regardless of their backgrounds, with simple measures of success being the comparative number of female and male staff within our workforce and those holding senior leadership positions.
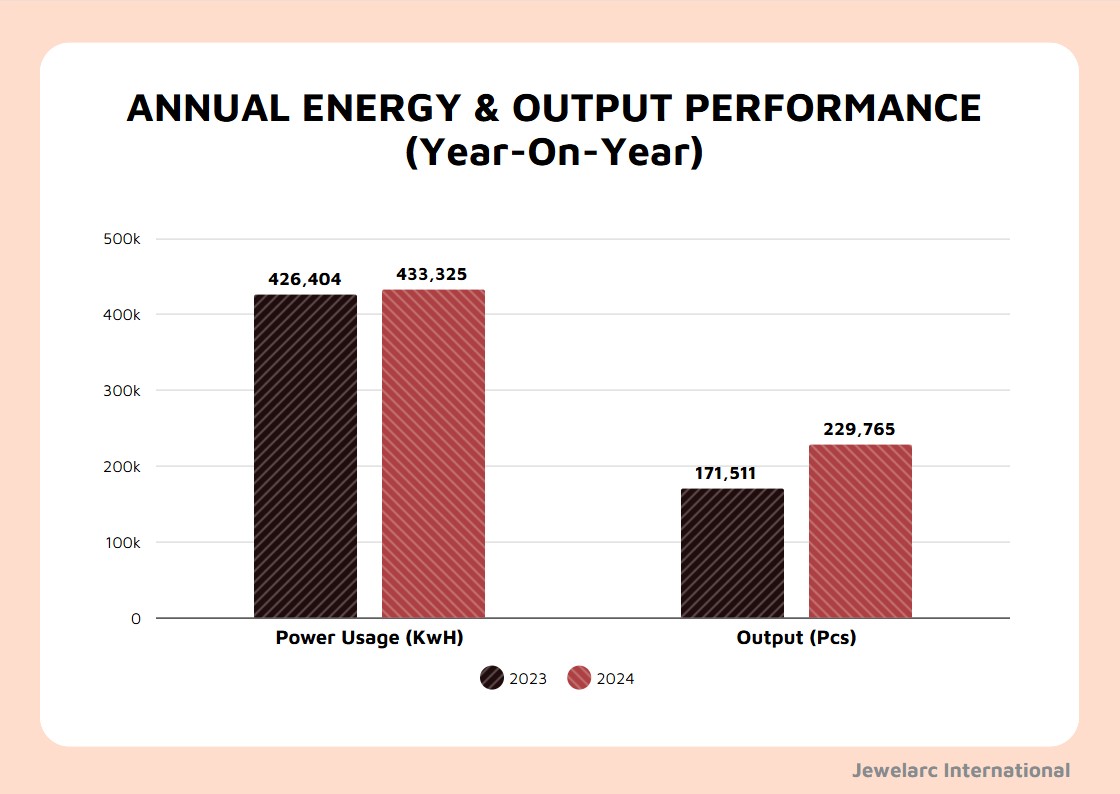
- The chart above presents a year-on-year comparison of power usage and production output for the years 2024 and 2025.
- In 2025, overall electricity consumption slightly decreased by approximately 4.6% compared to the same period in 2024, while production output increased significantly by about 30%.
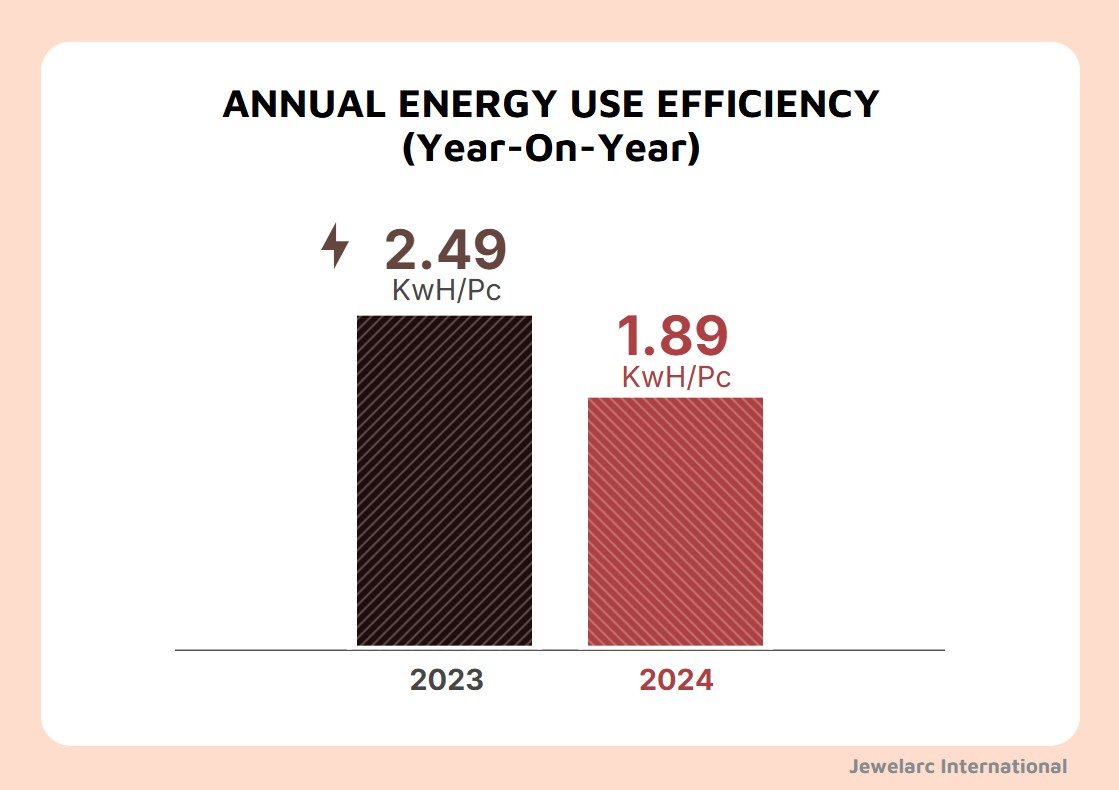
- This significant growth in output alongside reduced energy usage reflects a remarkable 27% improvement in energy efficiency per unit produced, highlighting enhanced process optimization and a strong move toward more sustainable manufacturing practices.
- Electricity is currently sourced from the national grid, however we remain on track with our plans to substantially reduce this reliance through the introduction of roof-top solar generation to be introduced by the end of 2027.
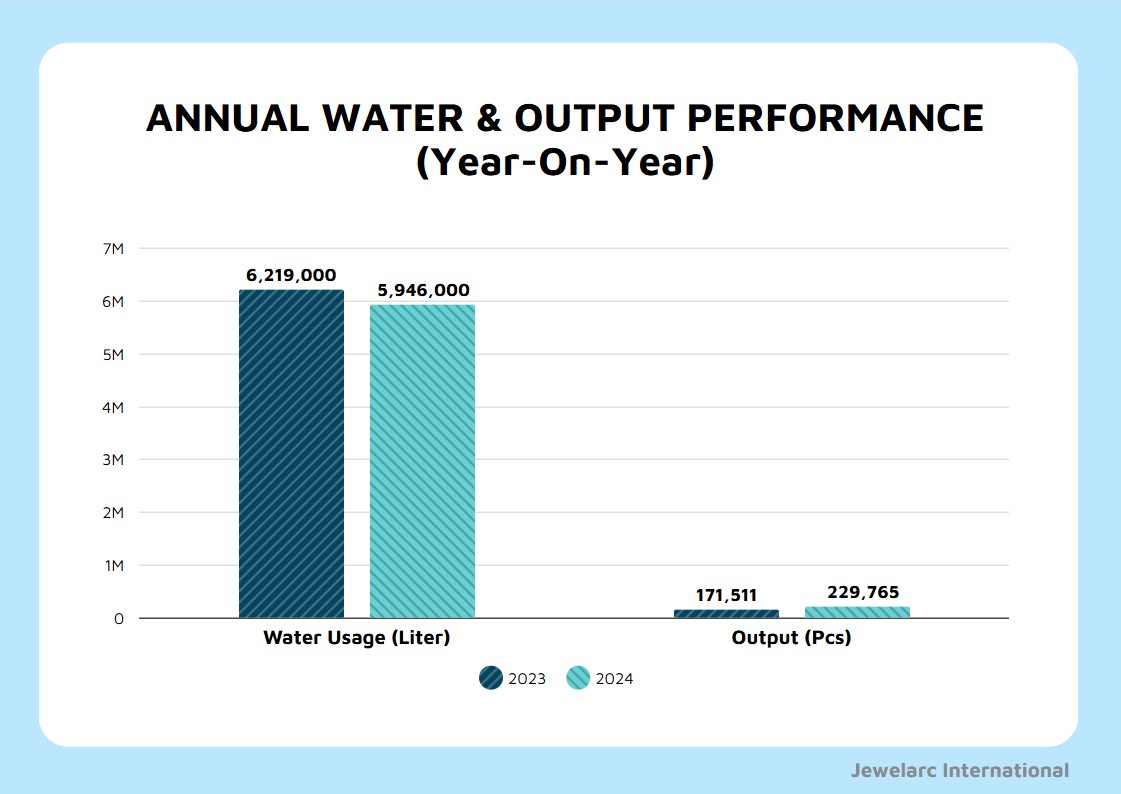
- The chart presents a year-on-year comparison of water usage and production output for the years 2024 and 2025.
- In 2025, the company achieved a significant 21.5%reduction in water consumption, while production output increased by approximately 30%over the same period.
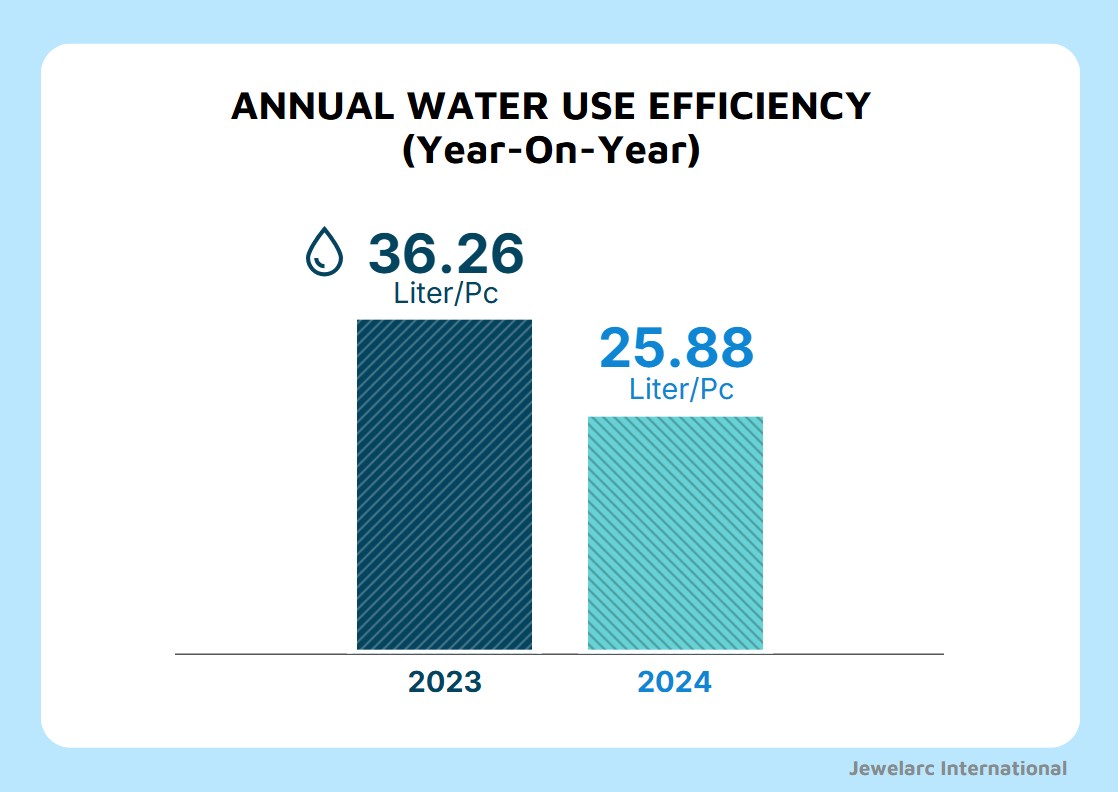
- This shift from 5.94 million liters to 4.66 million liters in water usage, along with the rise in output, indicates a strong improvement in resource efficiency and a continued move toward more sustainable manufacturing practices.
Waste that we can not recycle or reuse on site comprises the following categories which is monitored and measured and tracked against corresponding waste volumes in the previous year:
- Used investment powder – associated with the casting process
- Used factory consumables – such as cloths, production tissue, polishing powder, sand paper, etc
- Casting tree waste
- Waste recycled offsite – such as glass, metal, plastic, paper and cardboard
- Used toilet tissue – from our bathrooms
- Other general waste – not recyclable
- Contaminated waste - Hazardous waste such as used chemical containers.
- Process waste water - Water contaminated during industrial production.
- Recover metals - Precious metal scraps from production.
We are currently not tracking other forms of water leaving our facilities such as rainfall runoff from the roof and grounds, bathroom waste water and general non-collected production waste water.
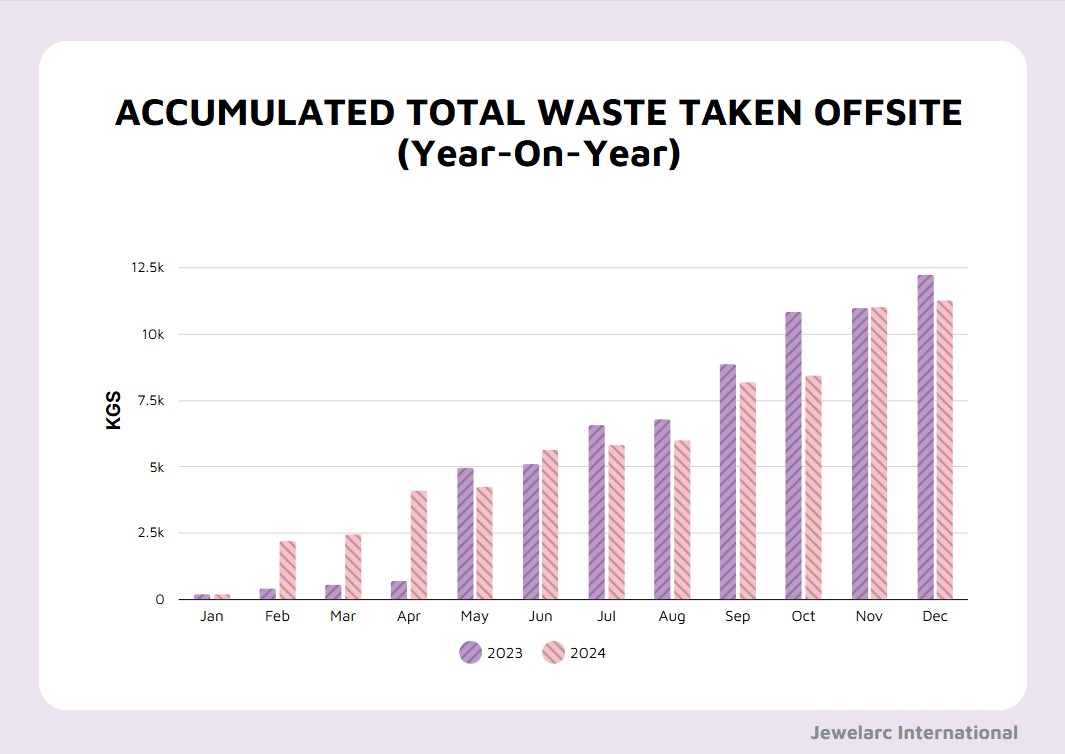
- The chart compares offsite waste disposal and production output for 2024 and 2025.
- Total waste taken offsite increased from 13,118 kg to 21,068 kg, while production output rose by 30% from 229,765 to 299,024 pieces.
- While total waste increased alongside higher production, this reflects the scaling of operations during a period of strong growth. We recognise that waste intensity per unit rose in 2025 and are actively reviewing additional waste reduction initiatives to improve performance moving forward.
- Waste not included in these figures are food scraps from our canteen and some post-production compostable plastic which are both disposed on-site through an organic composting process producing a rich bio-humus for our gardens and lawns.
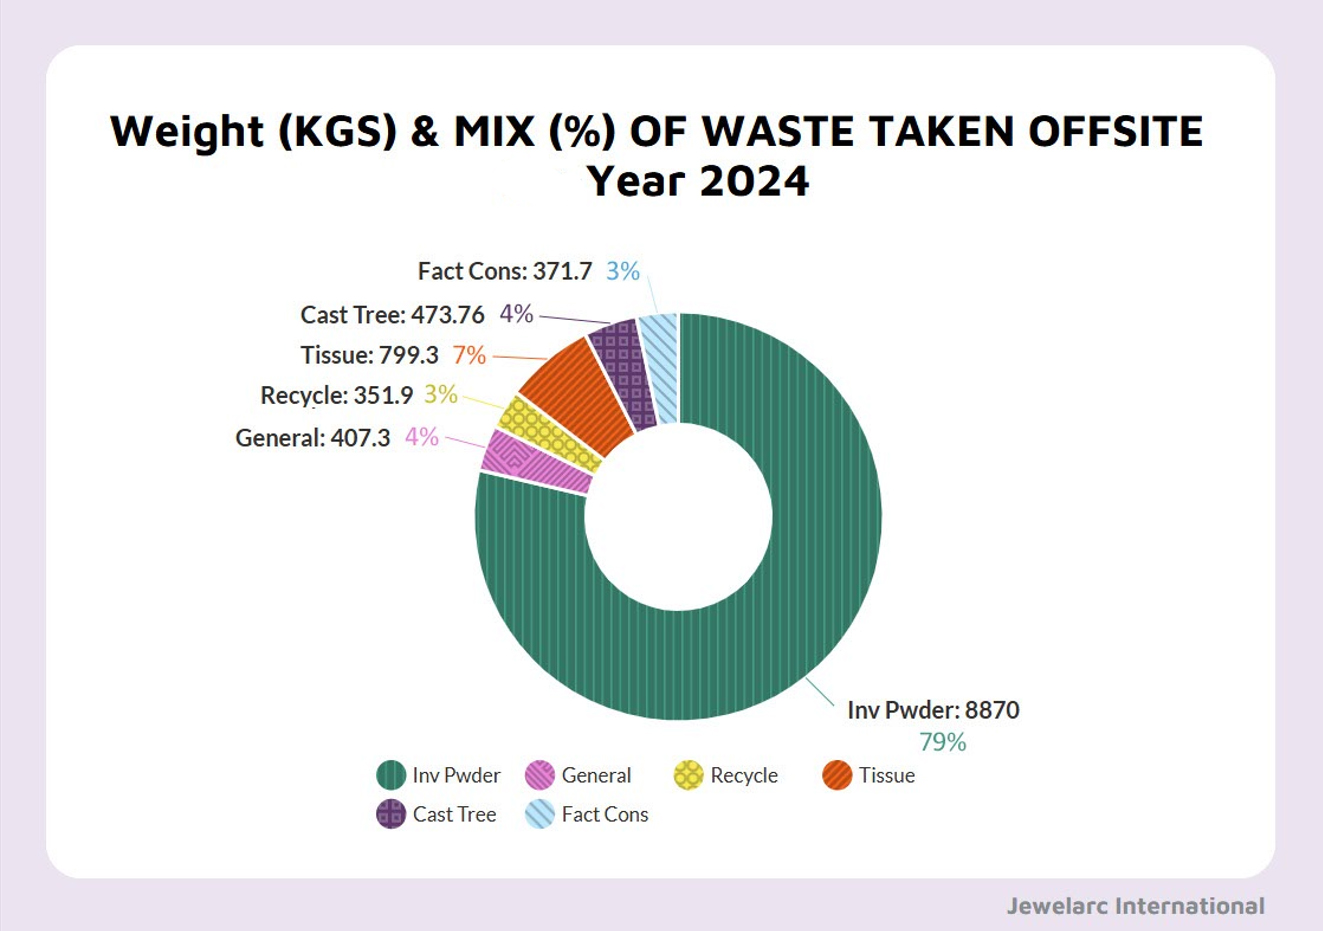
- The above chart is intended to summarise the major groups of waste which we need to dispose off-site
- Investment Powder is the dominant waste category, accounting for 15,200 kg or 72.15% of the total waste taken offsite.
- The second largest amount of waste taken offsite is Process Waste Water, accounting for 2,453.8 litres or 11.65% of the total.
- The third largest amount of waste taken offsite is used tissue paper collected from our bathrooms which represents 4.67% of the total. It is common practice in many Asian countries for toilets to be fitted with bidet-style water sprays. Tissue paper is then used solely for drying and is never flushed. The overall process is simple and regarded by most people as more hygienic than the traditional western style of toileting.
- Waste which can be recycled including metal, paper and cardboard comprises 1.82% or 382.5 kgs so far this year.
- Recovered Metals, comprising precious metal scraps collected from our production processes, account for 42.8 kg or 0.20% of the total waste taken offsite.
- All other waste disposed offsite is approximately equally comprised of factory consumables, casting tree waste, contaminated waste and general waste of around 2-3% each.

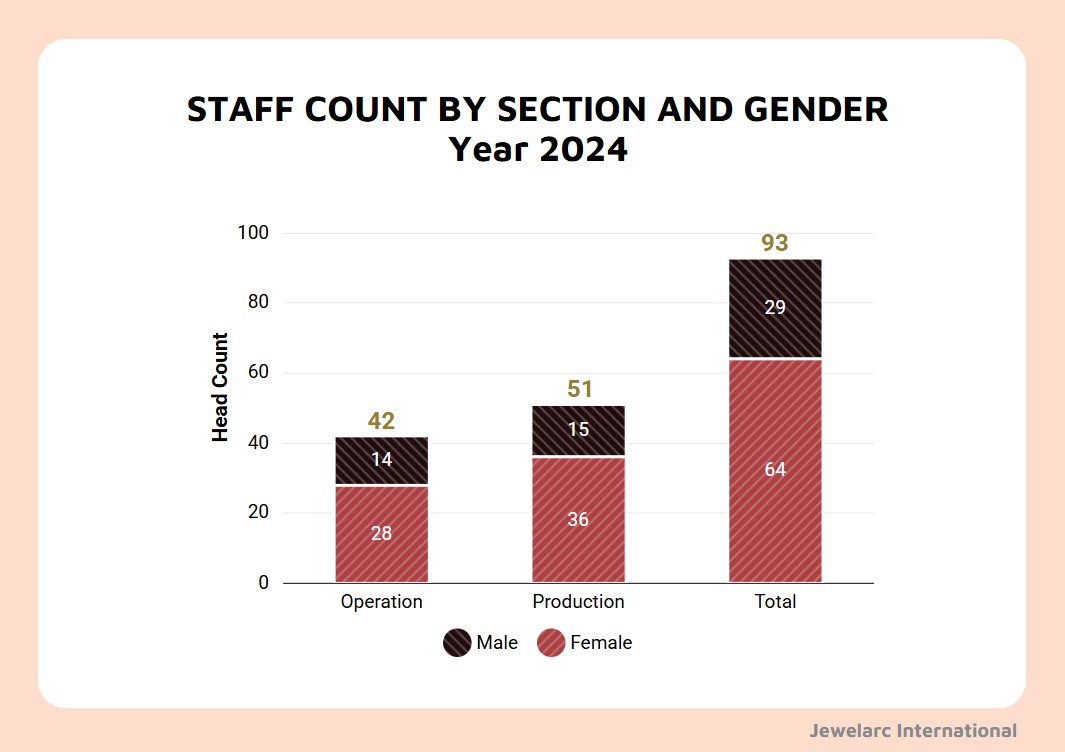
- For 2025, Jewelarc employs 95 permanent staff, with 45 people in Operations and 50 people working in Production-based roles
- Jewelarc equally accepts workers of any gender into any role, and they are selected and offered positions based only on their preference, their experience and our requirements at the time
- 67% of the total workforce are female and 33% are male, meaning that females currently outnumber their male counterparts by 2.1:1
- In Operations, the ratio of female staff to male staff is approximately 2:1
- In Production, the ratio is even higher around 2.3:1
- Jewelarc acknowledges and openly accepts and welcomes staff who prefer their gender identity to be non-binary, reflecting the general very high level of acceptance of these people in the wider Thai community. The above figures are based on the gender classification taken from citizen Identity Cards which currently only recognise the two traditional mainstream genders
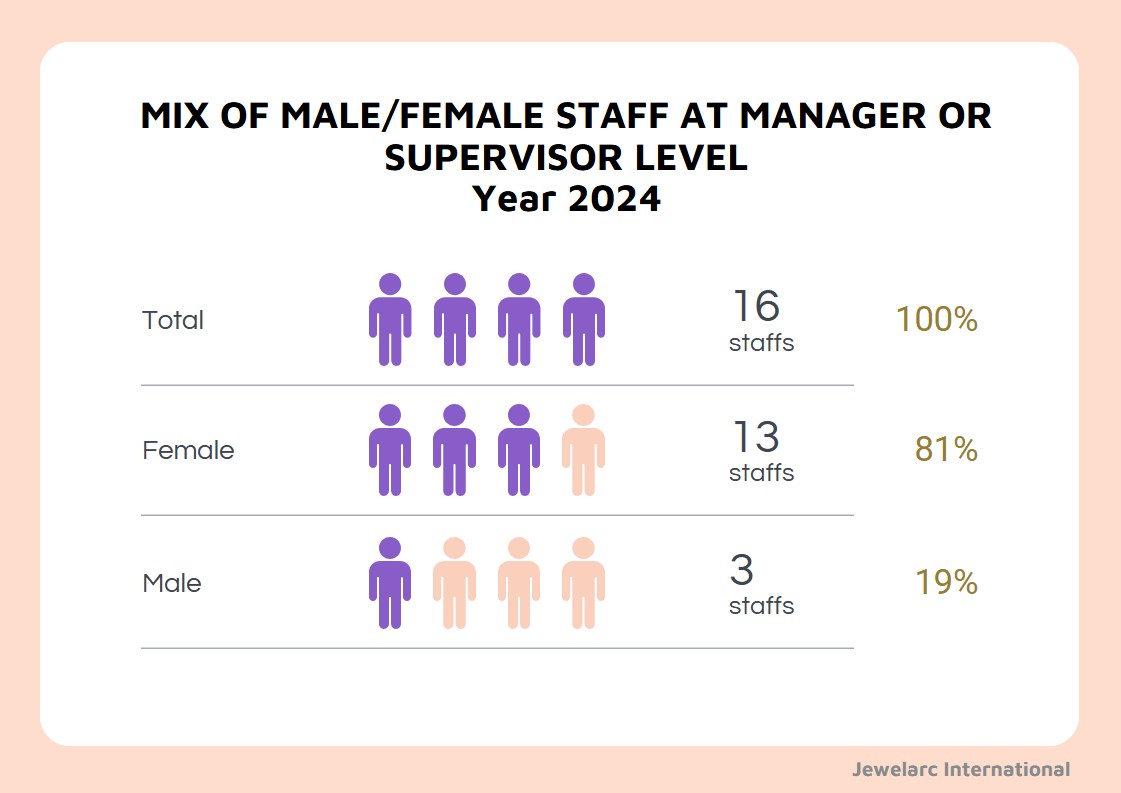
- 17 of our 95 permanent staff hold positions at the supervisor or higher levels
- 13 out of 17 leaders are female, accounting for 76%.
- The numbers reinforce Jewelarc’s policy of appointing the most appropriate person to each role based solely on each individual’s experience and ability and attitude
- Having more females than males in leadership roles is also a reflection of our policy to promote from within if at all possible, since we employ more females than males in the overall workforce
We are in the process of calculating the carbon footprint of our business operations with a view to continue working towards reducing our net carbon impact on the environment.
We already have a good idea of which parts of our operations lead to the most amount of carbon production, be that directly from what we do internally or what we buy-in and use or consume. Over six years ago we started taking definitive steps to reduce our impact, and the completion of the carbon footprint exercise will further help to expand and focus our efforts in all affected areas.
We accept that atmospheric carbon dioxide is one of the primary greenhouse gases that is contributing to global warming and consequently to climate change at a greater rate than ever. NASA reports that “human activities have raised the atmosphere's carbon dioxide content by 50% in less than 200 years” with the burning of fossil fuels being of major influence.
The problem is that carbon dioxide is being released at a far greater rate than natural and even man-made processes can remove this gas. This and other greenhouse gases in our atmosphere then act as a more efficient blanket or cap which traps more and more of the heat that the Earth might have otherwise radiated out into space.
We believe that taking steps to reduce the amount of carbon dioxide in the atmosphere is the responsibility of all citizens, business units and government bodies.
In a nutshell, we have heavily adopted the principles relating to …

The aim is simple: in our case, to make the same amount of finished goods – or possibly even increasing output - using less resources and producing less waste.
As above, we have already outlined some of the key results of following this philosophy, including our efforts to reuse and recycle, to reduce waste and to reduce our consumption of water and electricity.
To this data we need to comment further in respect of our use of electricity and our carbon sequestration initiative, with both subjects directly related to the reduction of carbon dioxide emissions on account of our business operations.
Currently, our primary source of electricity is the national grid. However, we have established a clear strategy to integrate rooftop solar energy by the end of 2027, further reducing our carbon footprint through on-site renewable generation.
As we are currently reliant on the grid, it is essential to understand Thailand’s energy mix. The carbon intensity of the electricity we consume is directly linked to the methods used by the national grid to generate power.
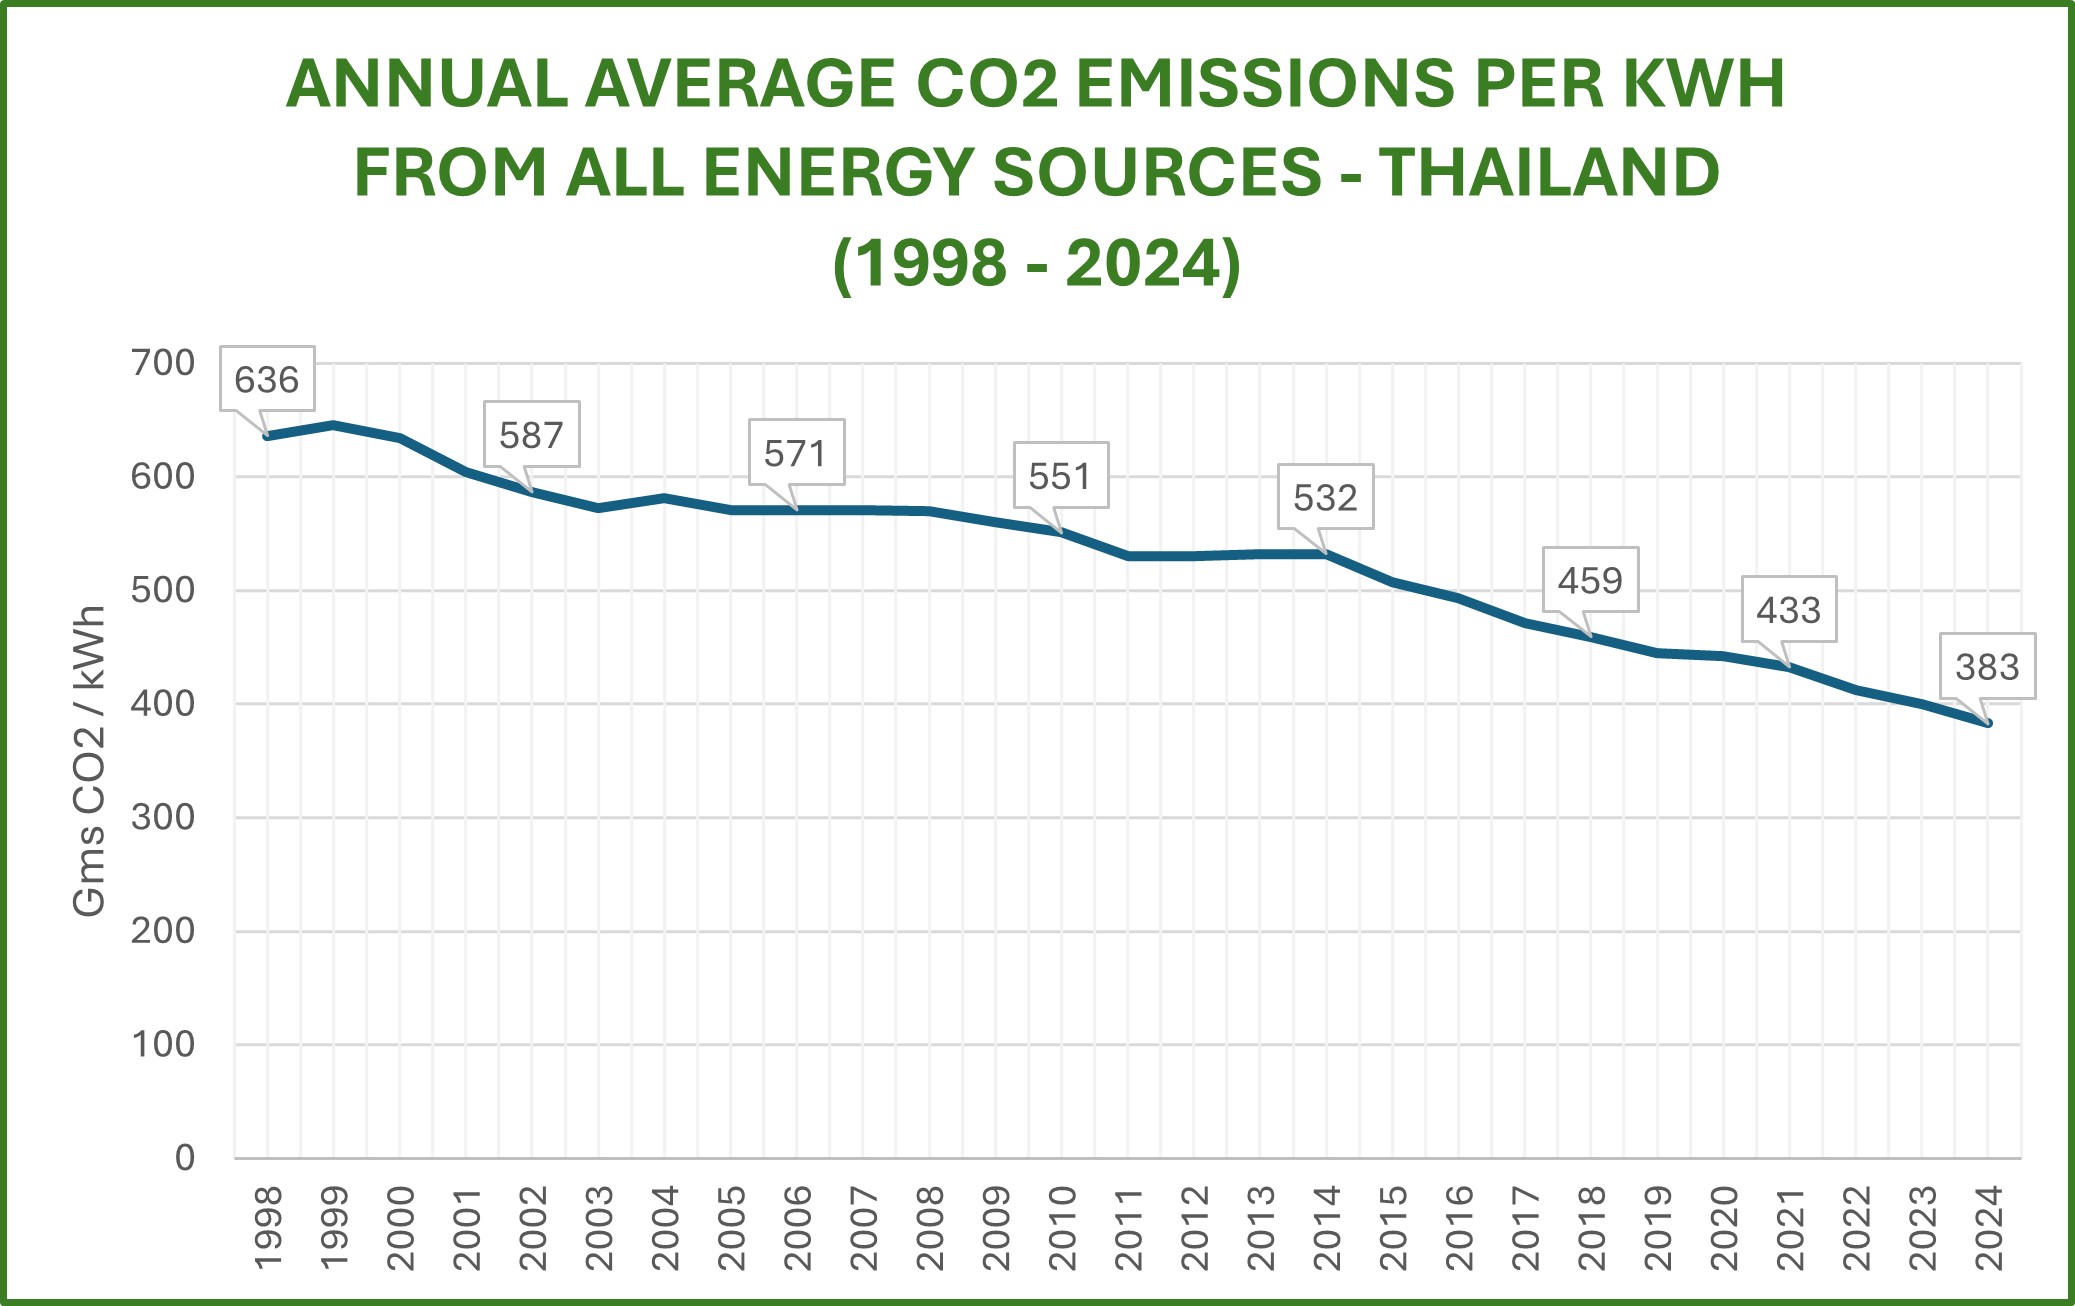
Data source: The Energy Policy and Planning Office of Thailand’s Ministry of Energy (https://www.eppo.go.th/index.php/en/en-energystatistics/co2-statistic)
The figures show the amount of CO2 emissions (in grams) associated with the production of 1 kWh of electricity in Thailand, averaged across all energy sources, across the past 26 years.
During this period, Thailand has achieved a remarkable 41% reduction in emission intensity, driven by a strategic shift toward renewable energy and significant technological advancements in power generation.
- Thailand Data (*): We utilize Consumption-based Grid Emission Factors provided by the Energy Policy and Planning Office (EPPO). This metric accounts for domestic production and clean energy imports (e.g., Hydropower from Laos), reflecting the actual electricity consumed.
- International Data: For benchmarking, we use Production-based data from Our World in Data (OWID) to maintain consistent global comparisons.
- Terminology: Carbon Intensity refers to the amount of CO2 emitted per unit of electricity generated (g/kWh).
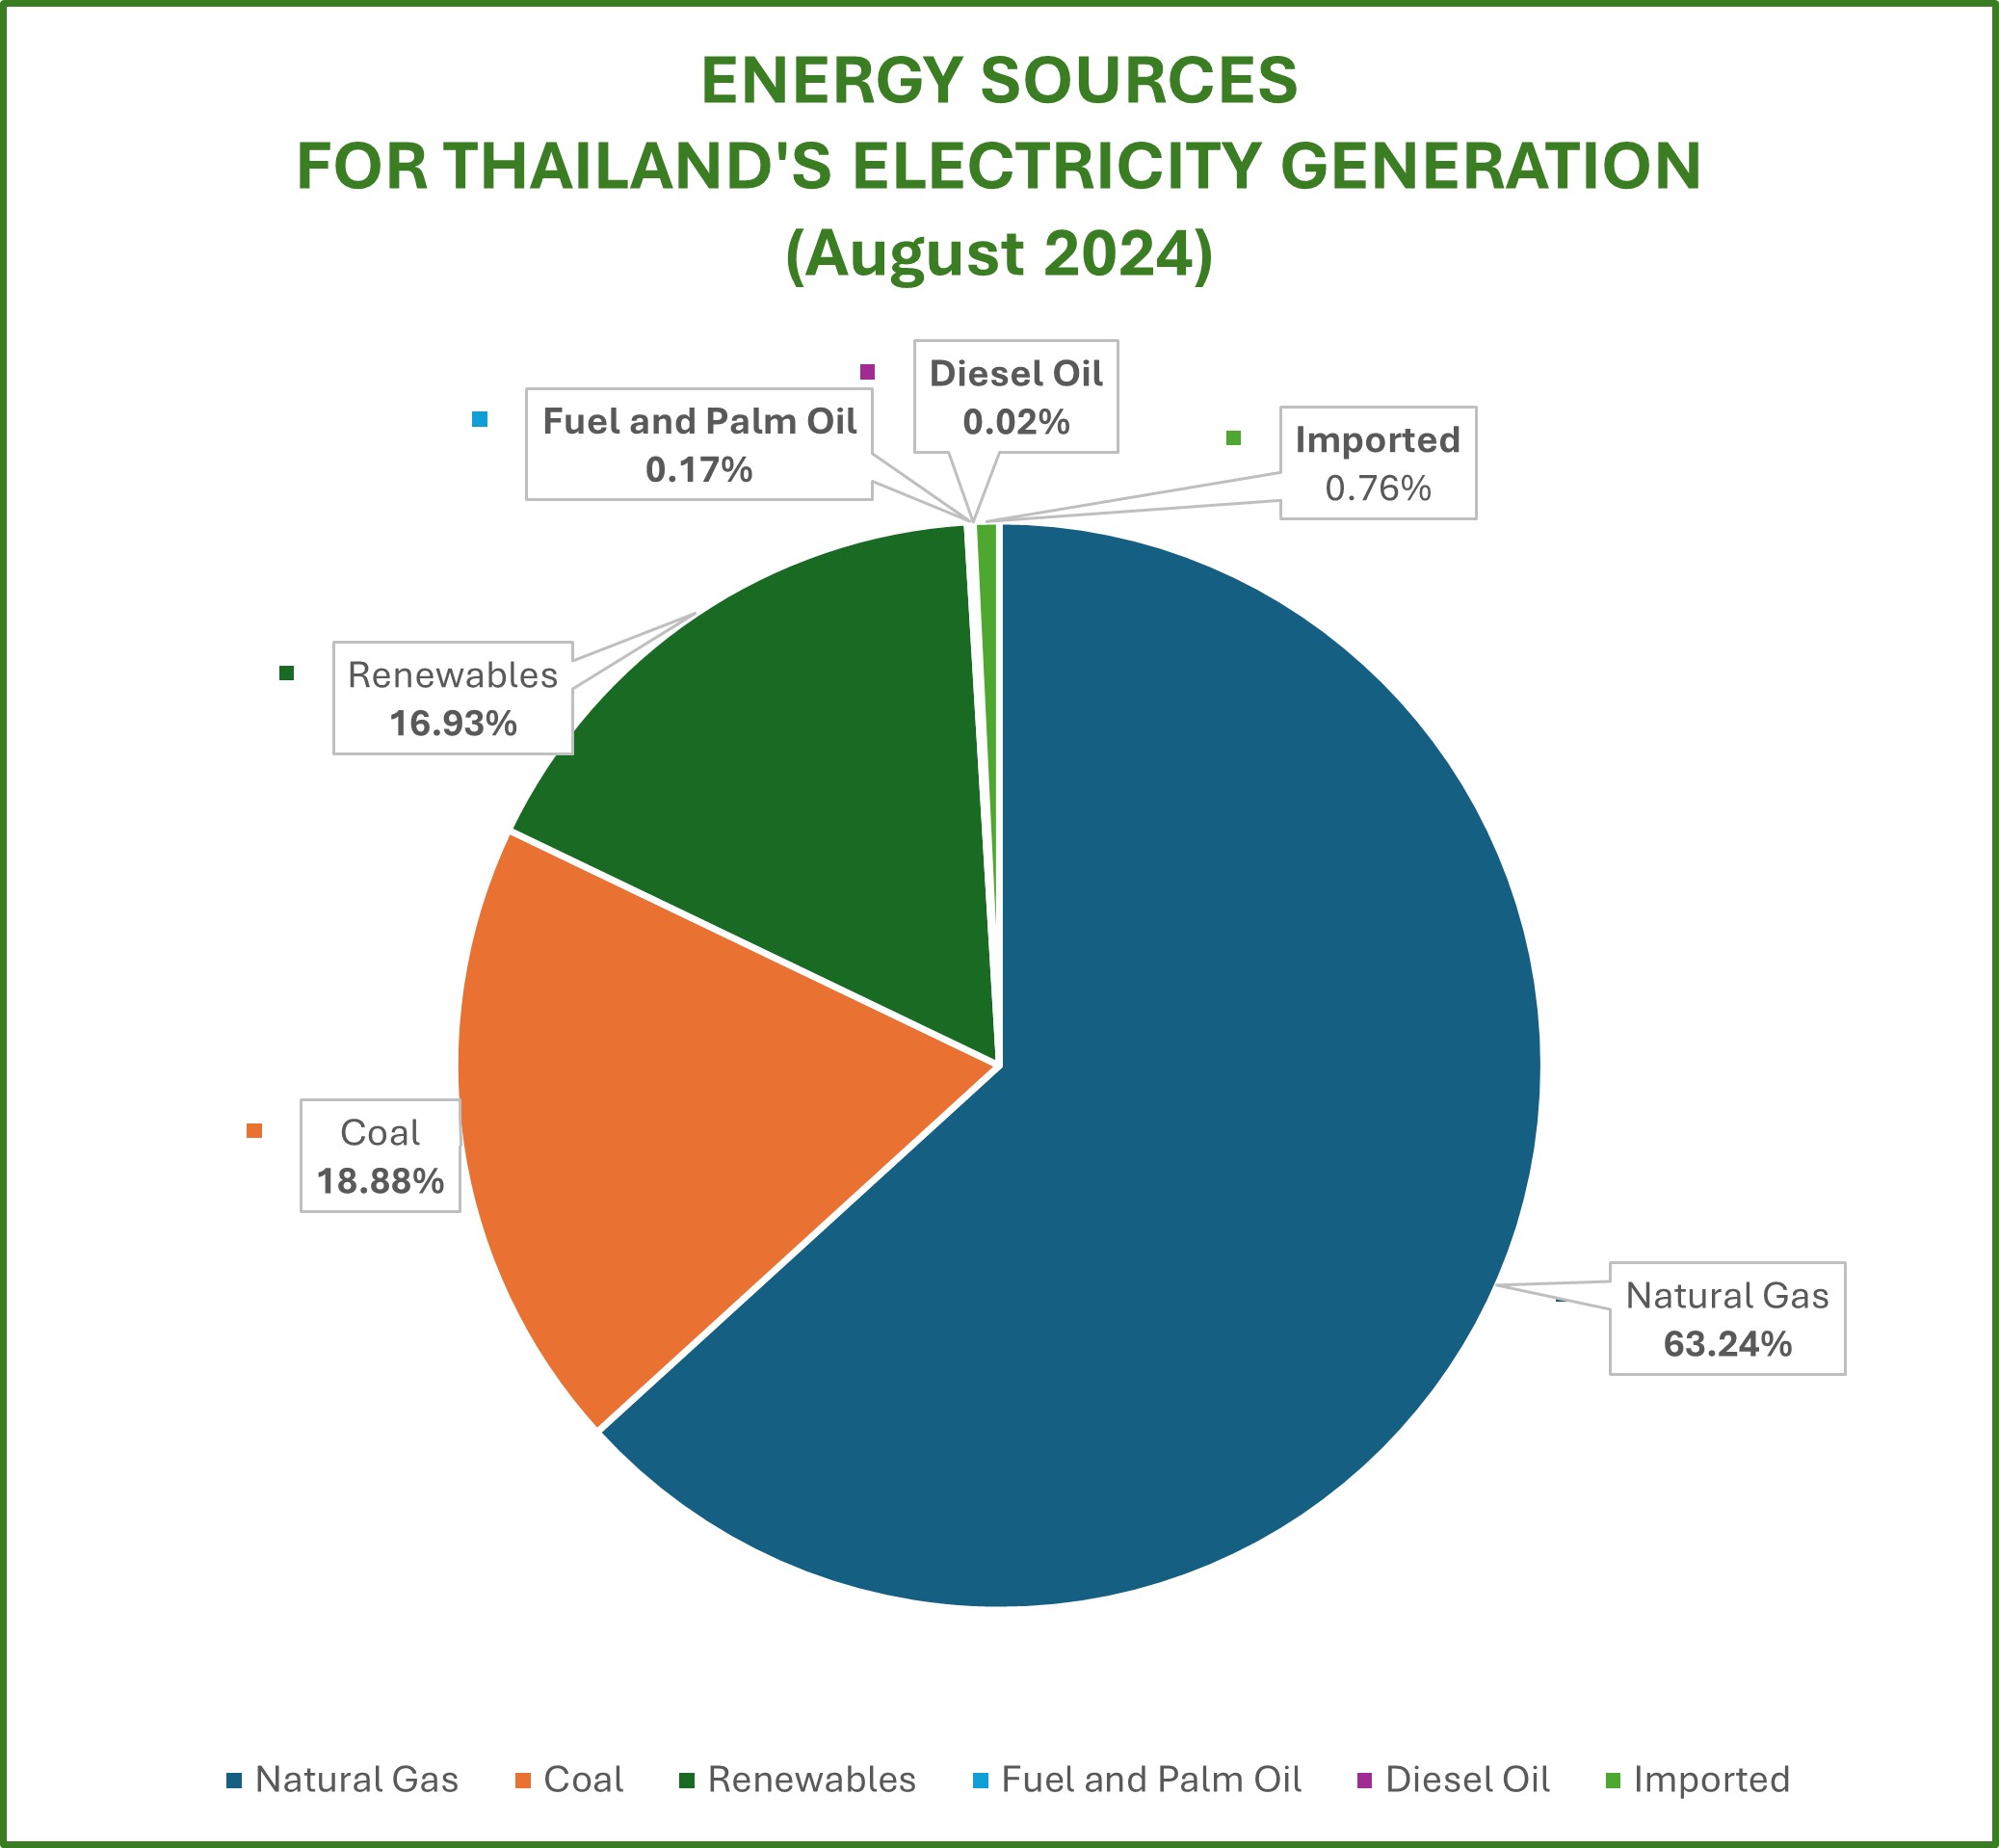
A significant contributing factor to Thailand’s relatively low level of CO2 emissions from power generation is its energy source mix, as follows.

Data source: Electricity Generation Authority of Thailand
The above chart summarises the primary energy sources for Thailand’s power generation, and it can be seen that natural gas accounts for 57% of the mix. While gas and coal are both non-renewable fossil fuels, this high portion of gas in Thailand is significant because its carbon intensity is only about half that of coal. This of course means that jurisdictions with a high portion of coal in their energy mix (such as Australia with 45% coal and 17% gas – source: energy.gov.au) will proportionally be producing higher CO2 emissions.
The conclusion we draw on the above data over Thailand’s energy mix is that the country is highly active in reducing its level of CO2 emissions from electricity generation and is making consistent solid progress and is competitively positioned when compared to many developed countries in their goal to reduce CO2 emissions.
Carbon sequestration is the process of capturing and storing atmospheric carbon dioxide. It is one method of reducing the amount of carbon dioxide in the atmosphere with the goal of reducing global climate change.
Jewelarc has its own Sequestration Program centred around the ability of trees to remove carbon from the atmosphere, storing it in their branches, stems, leaves, bark and roots. As trees grow, they remove carbon dioxide from the atmosphere through photosynthesis and convert this into carbon to make wood.

Our first initiative in this area is to consider the sequestration ability of the trees and other plants in our own factory compound, since around 40% of our total land area is landscaped gardens and open grassland area with around 20 large mature trees and more than 200 medium and smaller sized trees, shrubs and bushes.
We estimate the total amount of carbon being sequestered from within our compound is 2,180 kgs per year, or the equivalent of driving the average petrol powered vehicle around 8,000 km. While being a solid contribution to offsetting our total carbon footprint we want and need to do more.
Our second initiative involves the replanting of many more trees on selected government and community land around the world. Our plan is to use this project as a means to introduce school students to our sustainability program through education and tree planting activities, thereby helping them learn more about the challenges facing their generation and the wide range of opportunities for them to instigate change and improvements.